 How long does it take to sell a house in North Andover? It depends. Every home sale is unique, so the best we can do is deal in averages.
Depending on the time of year, it will probably take 1-3 months to sell your home in North Andover.
There are lots of things that factor in. The biggest is price, but let’s look at all of them.
If you want, you can use the jump menu below to skip to the detailed explanations below the infographic.
Table of Contents
- Infographic
- Breakdown
- Days on Market
- Listing Prices
- Market Absorption
- Economy Trends
- References & Sources
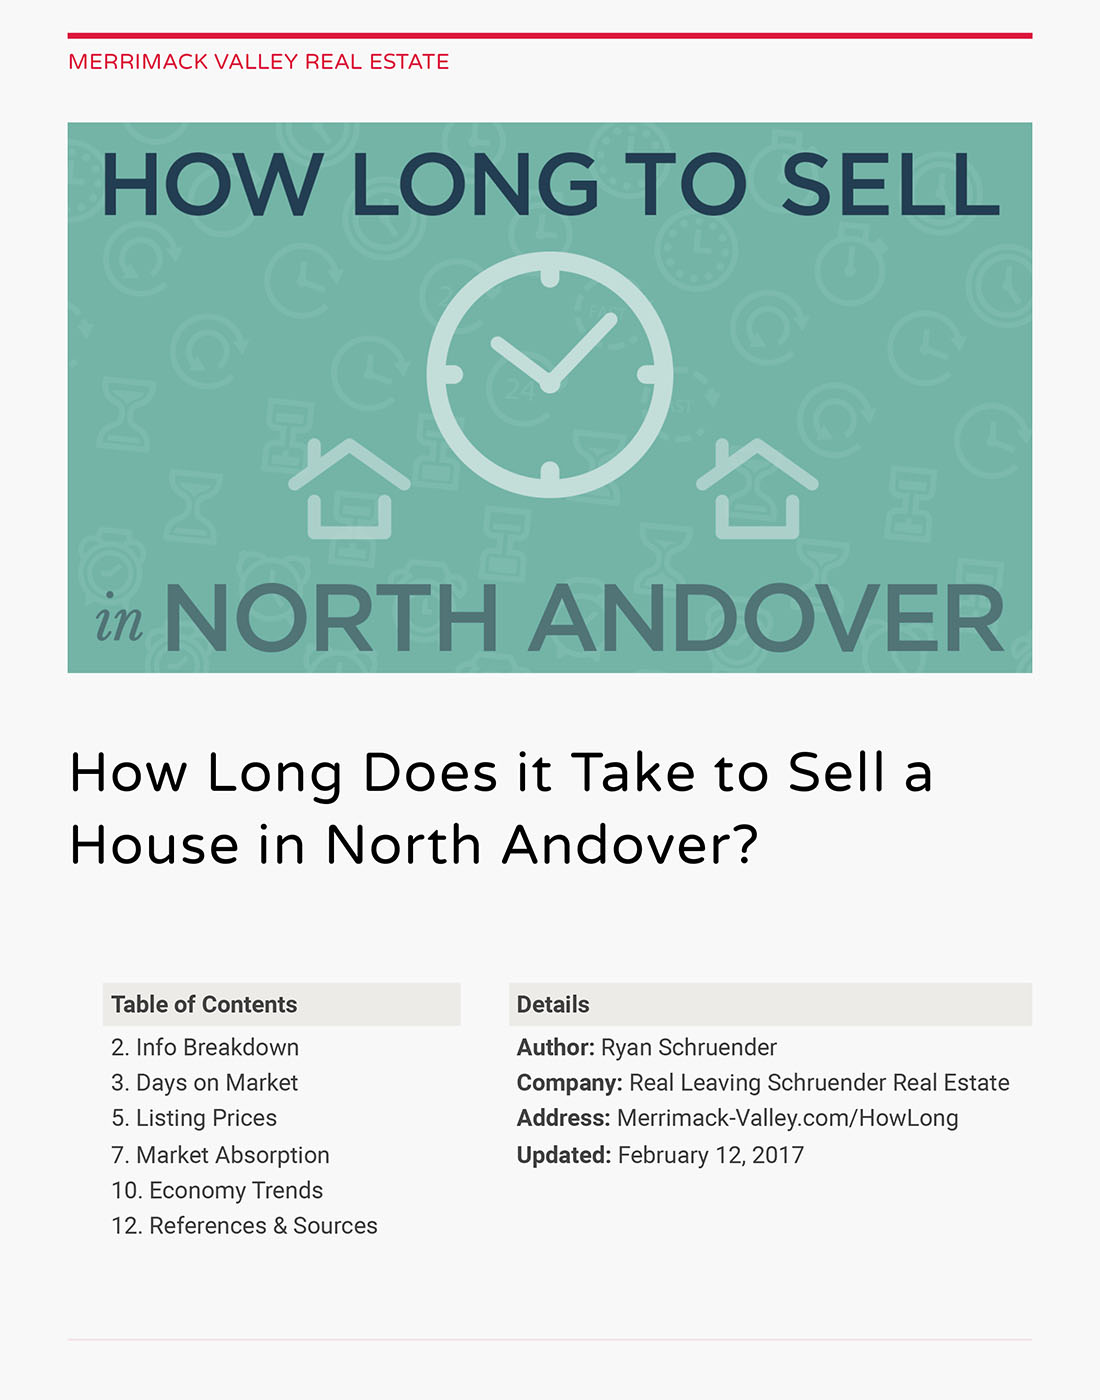
Selling a house in North Andover [Infographic]
Here’s an in-depth look at 4 major factors (and a few minor ones) that impact how long it takes to sell your North Andover home.
Infographic: How long does it take to sell a house in North Andover?
Let’s break this thing down
There’s a lot going on in the above infographic. If you’re not a North Andover real estate professional, some of it might be unclear.
So let’s break it down a little further.
First, some numbers.
Here’s a snapshot of the North Andover housing market for October 2015 through September 2016.
These data were compiled from several different sources. They’re explained in detail at the bottom of this post.
| 31 | Lowest median Days on Market 2016 (April) |
|---|---|
| 80 | Highest median Days on Market 2016 (January) |
| 1.22 | Average Market Absorption Rate for homes under $500,000 |
| 6.5 | Zillow Market Health Index (out of 10) |
| $468k | Median North Andover Home Value 2016 (Zillow) |
| $449k | Median Listing Price in North Andover 2016 (NAR) |
| $416k | Median North Andover Closing Price 2016 (NAR) |
| 15.5% | No Andover Listings with Price Cuts 2016 |
| 7.2% | No Andover Home Value Increase in 2016 |
Some of these numbers need a little explanation. See below for full details, but here’s the high-level overview for each row in the table above.
Keep in mind that these numbers may not be 100% accurate. They’re intended to give you a general sense of the NA housing market in 2016.
If you want exact figures, please get in touch and we can run the latest reports for you.
Days on the Market
Days on the Market is a common statistic used in real estate as an indicator of a market’s activity level.
If the D.O.M. is 60, it means that it takes an average of 60 days to for sellers to accept a purchase offer.
Lower is better.
Lower DOMs typically indicate a healthy, active real estate market. Spring months almost always have the lowest DOMs.
Fastest and slowest months
| 31 | Lowest median Days on Market 2016 (April) |
|---|---|
| 80 | Highest median Days on Market 2016 (January) |
Homes sell faster in April than January. That one’s pretty much a no-brainer.
It might be surprising to consumers to learn that April listings sell almost 3x faster than January. A huge difference.
All US real estate markets move fastest during the spring. But August & September look good too!
The big takeaway here is NOT that North Andover home sales happen fastest in March, April, and May.
That’s well known, even for non-realtors—how many Open House signs have you seen on warm spring Sundays?
The big takeaway here is that August and September move faster than June and July.
TWEET THIS: NA real estate sells faster in August & September than June & July.Click To TweetTo be fair to my industry: every real estate agent already knows that too.
Most consumers don’t.
Most people think that you have to list your house on March to have the best chance of selling it.
Turns out, if you miss the March/April window, you’ve got another great chance in late summer. The Labor Day crowd is typically motivated to buy quickly.
Lots of times it’s parents trying to get in before their kids start school! Sellers can always use that to their advantage.
Listing Prices
Listing Price curves often are opposite the DOM curve, shown above. Homes listed during the spring and summer months tend to have higher list prices than those listed during the fall and winter.
Like the DOM statistic above, Median List Price is a dataset that real estate industry professionals use to gage a market’s health. The higher the listing prices, the stronger the market.
We know it’s seasonal. So let’s look at the whole year in one average.
| $468k | Median Home Value — Zillow estimate |
|---|---|
| $449k | Median List Price — Realtor.com data |
| $416k | Median Closing Price — Realtor.com data |
These three numbers together paint a pretty clear picture:
On average, homes in North Andover sell for 88% of their value, and 92% of their asking price.

On average, homes in North Andover sell for 88% of their value, and 92% of their asking price.
Remember that these are median values, and they’re averaged across an entire year. If we dug deeper, we could break this out by season and see if homes sell for closer to 100% of asking or value in the spring, for example.
But for now, we can safely say that sellers in North Andover should be prepared to accept offers that are around 10-15% below the value of the home, and 5-10% below asking price.
TWEET THIS: North Andover real estate sells for 92% of asking price on average.Click To TweetOk, but how long will it take to sell?
Okay, okay. Back to the how long question.
Since this is a post about time more than money, let’s put the pricing and value numbers into perspective.
Most NA homes are listed for 5% below their value. If you list for less than 5% below (meaning: a higher list price, closer to the value), you can expect to wait longer to sell.
If you list for more than 5% below (lower list price, further below value), you can expect to sell faster.
Market Absorption Rate
The name “Market Absorption Rate” makes this stat sound more complex than it really is. It’s a little more complex than Days on Market, but not much.
Here’s what it means:
How many months will it take to sell the houses already listed (in a given area, and given price range)?
Kyle Hiscock, a very good real estate agent in upstate New York, summarized the M.A.R. stat like this:
For example, if a market absorption rate in a given area is 3.5, this means that it would take 3.5 months to sell the remaining number of homes for sale if no others were listed.
Every market is different, but in general, an MAR under 4 is considered a seller’s market, over 6 is a buyer’s market, and in between 4-6 is a balanced market.
So what do North Andover’s MAR numbers look like?
A 5-week supply
| 1.22 | Average Market Absorption Rate for homes under $500,000 |
|---|
It means that the entire inventory of available listings would sell within 1.22 months, or about 5 weeks. And this M.A.R. snapshot is from October, a historically mediocre month in Days-on-Market terms.
A 1.22 Market Absorption Rate is very good overall. Anything under 7 is considered “healthy.”
October is at the tail end of the fall real estate season, but well-priced houses still sell in this market.
The graph above shows that for houses listed for $799,999 or less are still in “buyer’s market” territory.
But remember:
MAR is a sliding scale. 1.22 months to sell 10 properties vs. 1.22 months to sell 1,000 properties are two very different stats.
The MAR snapshot shown in this graph is from October 2016, a historically mediocre month for new listings.
TWEET THIS: even in slow October, North Andover real estate would sell out in 5 weeks or lessClick To Tweet1.22 is a great number, but it would be even more impressive in April, when there’s guaranteed to be more way more inventory on the market.
Also, a disclaimer on the 1.22 number used above: it actually refers to Andover, not North Andover. At the time we published this article, the North Andover MAR data weren’t immediately available.
Market & Economy Trends
This one is a no-brainer for most folks: as the economy and housing market improve, houses sell faster.
There are exceptions to that rule, of course. But in broad terms, a strong economy means there are buyers lining up to make you an offer.
It’s also no secret that the US housing market tanked pretty hard in the later part of the last decade.
There’s some debate on whether or not the housing market has fully recovered from the crash, but there are plenty of experts who say yes—we’re back, baby.
North Andover’s real estate market is far ahead of its pre-crash levels.
While the state of the US real estate market is still up for debate, the state of North Andover’s market is not.
North Andover real estate market recovered from the crash in September 2015 and it hasn’t looked back since.
By all measures, the current economic climate and real estate market in North Andover will contribute to selling your home fast.
2016 was a great year and 2017 looks to be even better.
TWEET THIS: the North Andover real estate market recovered from the crash in Sep 2015Click To TweetWant to sell a house in North Andover?
You’ve come to the right place. We can’t make January listings move like April, but we can try!
Our team of North Andover experts will use our knowledge and expertise—like the information above in this blog post!—and use it to sell your house in North Andover fast! Give us a call.
References & Data Sources
- http://www.realtor.com/local/North-Andover_MA
- http://www.zillow.com/north-andover-ma/home-values/
- http://www.mapropertiesonline.com/statsabsrate.php?town=Andover&proptype=SF
- https://www.thebalance.com/how-long-does-it-take-to-sell-a-house-1799050
- https://www.redfin.com/blog/2016/08/how-long-does-it-take-to-sell-a-house.html
- http://www.realtor.com/advice/sell/how-long-does-it-take-to-sell-a-house/
- http://www.homes.com/blog/2015/12/long-take-sell-house-today/
- http://homeguides.sfgate.com/average-length-time-takes-sell-house-62594.html
- http://www.rochesterrealestateblog.com/how-long-does-it-take-to-sell-a-home/
 Sign up for the Free ‘Mack Valley Newsletter
This post is incredible, Ryan. I don’t know if I’ve ever seen another realtor share this much detail and insight on a local market. If I still lived in NA, I’d be all over this! Thanks very much for sharing. Keep up the good work!
Thanks TJK! It took a while to get all the data, but it was worth it! Glad you like it, thanks for commenting.
Wow…great post!